Website Speed Optimization Services India: 2026 Guide
Only about a third of websites currently pass all three Core Web Vitals, and on mobile the picture is worse. Yet mobile is where most Indian traffic arrives, often on a mid-range Android handset riding a congested network. That gap between how a site performs on a developer's laptop and how it performs in a customer's hand is the entire business case for website speed optimization services India teams now sell as a standalone engagement.
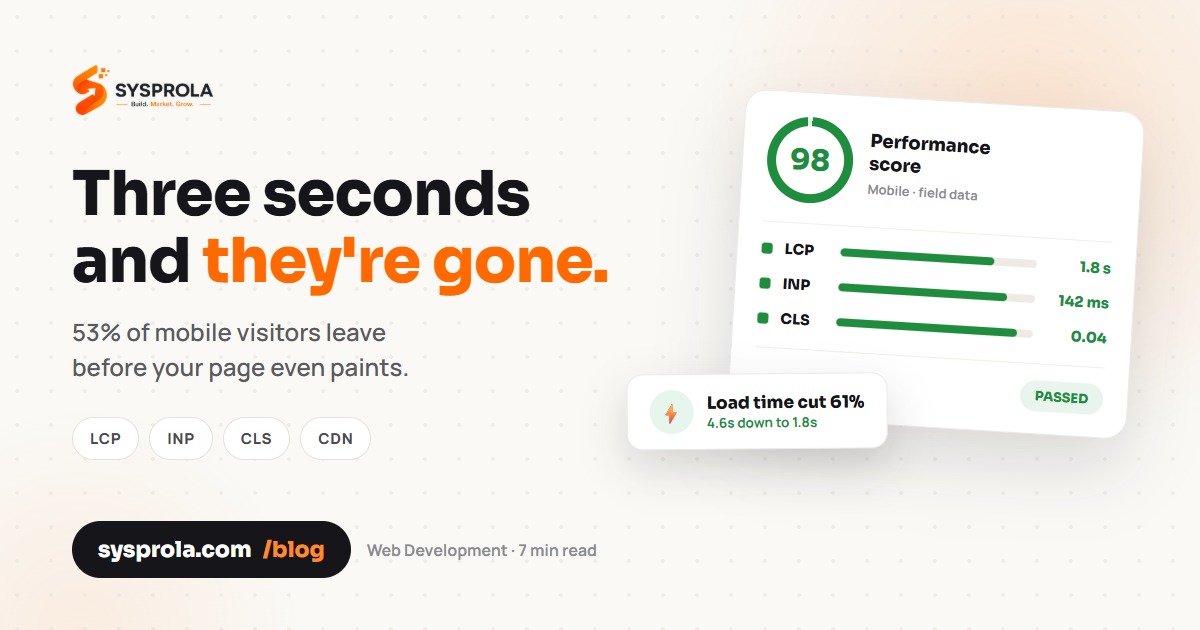
The numbers are unusually clear for a marketing topic. Roughly 53 percent of mobile visitors abandon a page that takes longer than three seconds to load. Every additional second of load time is associated with around a 7 percent drop in conversions. Rakuten's widely cited case study recorded a 53 percent increase in revenue per visitor after Core Web Vitals work, with no other variable changed. Speed is not a technical hygiene item. It is a revenue lever.
What Core Web Vitals Actually Measure in 2026
Google's three metrics each describe a different way a slow site frustrates a person.
- LCP, Largest Contentful Paint. How long until the main content is visible. Target is under 2.5 seconds. This is the metric most sites fail, with roughly 58 to 68 percent of origins passing.
- INP, Interaction to Next Paint. How quickly the page responds when someone taps or clicks. Target is under 200 milliseconds. INP replaced First Input Delay in 2024 and is the hardest of the three to pass, with around 43 percent of sites still failing the threshold.
- CLS, Cumulative Layout Shift. How much the layout jumps around while loading. Target is under 0.1. This is usually the easiest to fix and the most irritating to users when broken.
Field data from real Chrome users, not lab scores, is what Google uses. A perfect Lighthouse score on a fast desktop connection means very little if your actual visitors are on a 4G connection in Kukatpally.
Where Indian Websites Typically Lose Their Speed
Oversized, Unoptimised Images
Still the single largest offender. A hero image exported at 3000 pixels wide and served as a 1.4 MB JPEG to a phone that needs 800 pixels wastes most of the page budget before anything else loads. Modern formats, correct sizing, lazy loading below the fold and explicit width and height attributes solve this in a day.
Plugin and Script Bloat
The typical WordPress site accumulates 25 to 40 plugins, each adding CSS and JavaScript to every page whether needed or not. Add a tag manager loading six tracking scripts, a chat widget, a popup tool and three font families, and the browser is parsing hundreds of kilobytes of JavaScript before it can respond to a tap. This is the primary cause of failing INP.
Cheap or Distant Hosting
Shared hosting with a server response time above 600 milliseconds caps your LCP no matter how well the front end is built. Hosting physically distant from your audience adds latency on every request. For an India-focused business, an Indian or Singapore region origin plus a CDN is the baseline.
Render-Blocking Resources and Third-Party Embeds
CSS and JavaScript loaded in the document head halt rendering until they finish downloading. Critical CSS inlining, deferring non-essential scripts and self-hosting fonts typically remove one to two seconds of perceived load time. Embedded videos, maps and social feeds pull in entire frameworks, so facade patterns that show a lightweight placeholder and load the real embed only on click recover large amounts of main thread time.
What a Real Speed Optimization Engagement Looks Like
- Field measurement first. Pull real user data from Chrome UX Report and PageSpeed Insights on your top ten templates, not just the homepage. Establish a baseline you can be judged against.
- Diagnosis by metric. Separate the LCP problem from the INP problem, because the fixes are unrelated. LCP is usually images, hosting and render-blocking assets. INP is almost always JavaScript execution.
- Server and delivery layer. Caching, compression, HTTP/2 or HTTP/3, CDN configuration and an origin close to your users.
- Asset optimisation. Image conversion and sizing, font subsetting, CSS and JavaScript minification and code splitting.
- Main thread reduction. Audit every third-party script for business value, remove what nobody uses, defer the rest, and break up long tasks.
- Layout stability. Reserve space for images, ads and dynamic content so nothing shifts after paint.
- Regression monitoring. Speed decays. Without ongoing monitoring, a site optimised in March is failing again by September as new plugins and campaigns are added.
What This Costs in India
A focused audit with a prioritised fix list generally runs ₹15,000 to ₹40,000. Implementation on a standard business or WordPress site is usually ₹35,000 to ₹1,20,000 depending on how much of the theme and plugin stack has to be reworked. A large eCommerce build, where catalogue templates, search and checkout all need attention, typically starts around ₹1,50,000 and scales with complexity. Ongoing monitoring is commonly bundled into a maintenance retainer at ₹8,000 to ₹25,000 per month.
Weigh that against the arithmetic. If a site does ₹50 lakh a year online and a 500 millisecond improvement lifts conversions by even 3 percent, the work pays for itself several times over in the first year.
Speed and Search Visibility
Core Web Vitals are a confirmed ranking signal, though a modest one compared to relevance and authority. The larger effect is indirect. Faster pages mean lower bounce, longer sessions and more pages per visit, and those behavioural signals compound. Speed also directly improves paid media efficiency, because Google Ads quality scores account for landing page experience, so a slow page raises your cost per click on every campaign you run.
Frequently Asked Questions
What is a good page load time in 2026?
Aim for Largest Contentful Paint under 2.5 seconds, Interaction to Next Paint under 200 milliseconds and Cumulative Layout Shift under 0.1, measured on real mobile users rather than a lab test. In practical terms that means your main content should be visible within about two and a half seconds on a mid-range Android phone on 4G. Anything past three seconds starts costing you roughly half your mobile visitors.
Why does my site score well in Lighthouse but still feel slow?
Lighthouse runs a simulated test on a specific throttled profile, while Google's actual ranking data comes from the Chrome User Experience Report, which reflects real visitors on real devices and networks. If your audience skews toward older Android phones or slower connections, field data will be much worse than lab scores. Always validate against CrUX or PageSpeed Insights field data before declaring a site fast.
How much does website speed optimization cost in India?
An audit with a prioritised action list typically runs ₹15,000 to ₹40,000. Full implementation on a standard business or WordPress site is usually ₹35,000 to ₹1,20,000, depending on how much of the theme and plugin stack must be rebuilt. Complex eCommerce projects generally start around ₹1,50,000. Ongoing monitoring to prevent regression is commonly ₹8,000 to ₹25,000 per month within a maintenance plan.
Which Core Web Vital is hardest to fix?
Interaction to Next Paint, by a clear margin. LCP and CLS respond to fairly mechanical fixes like image optimisation, caching and reserving layout space. INP failures come from JavaScript occupying the main thread, which usually means auditing and removing third-party scripts, splitting long tasks and sometimes rewriting parts of a theme or app. That work touches functionality, so it needs testing rather than a plugin.
Can a caching plugin alone fix my Core Web Vitals?
A good caching plugin will help LCP meaningfully by serving pre-built pages and enabling compression, and it is a sensible first step. It will do very little for INP, because caching does not reduce how much JavaScript the browser must execute once the page arrives. Sites that rely on a plugin alone typically move from failing to borderline, then stall. Real gains need work on the asset and script layer.
Does site speed affect Google Ads performance?
Yes. Landing page experience is a component of Google Ads Quality Score, and a slow page lowers that score, which raises your cost per click and reduces impression share for the same budget. The compounding effect is significant on high-spend accounts. Improving landing page speed is often one of the cheapest ways to reduce paid acquisition cost without touching bids, targeting or creative at all.
Related topics
Ready to grow? Get a free consultation from Sysprola today.